
A profit and loss statement (P&L) answers one question: over a set period, did the business earn more than it spent? You read it from the top down. Start with sales, subtract the direct cost of what you sold to reach gross profit, subtract overheads to reach operating profit, then take off interest and tax to reach the bottom line. If you sell online across several marketplaces, our All-inclusive plan covers the bookkeeping that makes those numbers trustworthy. The rest of this guide shows you what each line means and which ones deserve your attention.
Key takeaways
- A P&L records income and expenses over a specific period and flows from sales, to cost of sales, to gross profit, to overheads, to net profit.
- Do not stop at the final profit figure. Gross margin and operating margin tell you whether the problem is your pricing and sourcing or your overheads.
- A single month in isolation says little. Compare against the previous period, the same month last year and your budget.
- Your P&L only means something if the books behind it are complete and reconciled. Missing fees, refunds or stock make it flatter you.
- Sales on the P&L feed your VAT position. The registration threshold is £90,000 of taxable turnover.
Table of Contents
- What a profit and loss statement actually shows
- Read it from the top: the lines in order
- A worked example: £100,000 of online sales
- The two margins that do most of the work
- Compare, never read in isolation
- Check the P&L is trustworthy before you analyse it
- Accruals or cash basis: it changes how you read the page
- What your P&L tells you about VAT
- Limited companies: the P&L inside your statutory accounts
- Our perspective: what we see when sellers open their P&L
- Getting a P&L you can rely on
- A quick monthly P&L routine
- FAQ
- Sources
What a profit and loss statement actually shows
The P&L, also called the income statement, is one of the two core financial statements. The other is the balance sheet. The balance sheet is a snapshot of what you own and owe on one date. The P&L is a film of what happened between two dates: a month, a quarter or your accounting year.
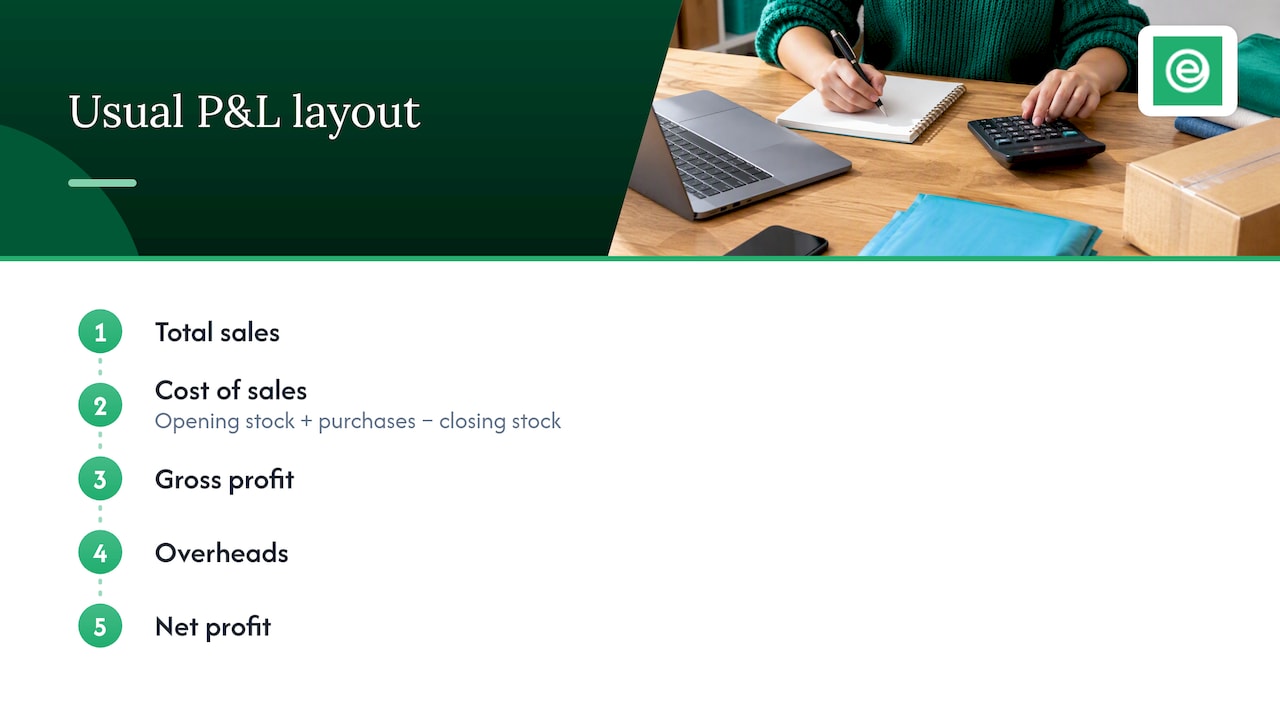
The ICAEW describes the usual layout as total sales, cost of sales (opening stock plus purchases less closing stock), gross profit, overheads and finally net profit. That order is the same whether you are a sole trader selling candles on Etsy or a limited company importing electronics for Amazon.
To answer a common question: “profit and loss” and “profit and loss statement” are the same thing. You will also see “P&L account”, “income statement” and, in company accounts, “statement of profit or loss”. The structure is the same.
Read it from the top: the lines in order
Revenue (turnover or sales)
This is what customers paid you for goods or services in the period, before costs. For online sellers, check two things straight away:
- Is it net of refunds and returns? Gross sales of £100,000 with £6,000 refunded is £94,000 of real revenue.
- Is VAT excluded? If you are VAT registered, the VAT you collect belongs to HMRC. It should not sit in revenue. If your P&L revenue looks suspiciously high, VAT is often the reason.
Cost of sales
These are the costs directly tied to what you sold: the stock itself, inbound freight and import duty, packaging, and often outbound postage and marketplace fulfilment fees, depending on how you set up your chart of accounts. The key point is consistency. Whatever you class as cost of sales this year, class the same way next year, or your comparisons are meaningless.
Stock is where many sellers go wrong. Cost of sales is not what you bought in the period. It is what you bought, adjusted for the stock you started and finished with. Buy £40,000 of inventory in a month and sell half of it, and only the sold half belongs in cost of sales. The rest is an asset on the balance sheet.
Gross profit
Revenue minus cost of sales. It shows whether your core offer makes money before the overheads arrive. A business with a weak gross profit cannot fix things by trimming the office subscriptions.
Overheads (operating expenses)
The costs of running the business that do not vary directly with each sale: advertising, software, accountancy, insurance, wages, rent, bank charges, depreciation. Marketplace and payment fees can be in either place. Pick a treatment and stick with it.
Operating profit
Gross profit minus overheads. This is the profit from trading itself, before interest and tax. For many owners it is the most honest number on the page.
Net profit
Operating profit after interest and tax. For a limited company that means corporation tax. For a sole trader, income tax is a personal bill, so it does not normally appear as a business expense on the P&L. If you want to understand what tax is coming, our guide to UK corporation tax rates, including marginal relief is a good next read.
A worked example: £100,000 of online sales
The numbers below are an illustration, not real client data. Imagine a limited company selling homeware through its own website and a marketplace.
| Line | This year | Last year |
|---|---|---|
| Revenue (net of refunds, excluding VAT) | £100,000 | £85,000 |
| Cost of sales | £58,000 | £46,000 |
| Gross profit | £42,000 | £39,000 |
| Platform and payment fees | £5,500 | £4,000 |
| Advertising | £14,000 | £9,000 |
| Software, insurance, accountancy | £4,000 | £3,500 |
| Other overheads | £3,000 | £2,500 |
| Total overheads | £26,500 | £19,000 |
| Operating profit | £15,500 | £20,000 |
Revenue rose 17.6%, which looks like a good year. Now read down the page.
- Gross margin is 42% (42,000 ÷ 100,000), down from about 45.9% last year (39,000 ÷ 85,000).
- Operating margin is 15.5%, down from about 23.5%.
- Operating profit fell by £4,500 even though sales grew by £15,000.
The story: sales growth was bought with advertising, and the cost of what was sold rose faster than the revenue. You would not see any of that by looking at turnover alone, and a profit of £15,500 on its own would not tell you it was a worse year than the last.
The two margins that do most of the work
The ACCA’s guidance on interpreting accounts uses the same ratios. The gross profit margin is gross profit divided by revenue, times 100, and the operating profit margin is operating profit divided by revenue, times 100.
- Gross margin shows direct trading performance: pricing, supplier costs, discounting and product mix.
- Operating margin shows how well you control the indirect costs of running the business.
ACCA notes that a fall in gross margin can mean you are failing to pass rising supplier costs on to customers or selling lower-margin goods. Practitioners add that a slipping gross margin on steady sales often points to poor stock management or weak supplier negotiation.
As a rule of thumb, diagnose in this order:
- Gross margin down, overheads steady: look at pricing, discounts, supplier costs, returns and shipping.
- Gross margin steady, operating margin down: look at advertising, wages, software and other overheads.
- Both steady, profit down: check for a one-off, a timing issue or a change in how items are coded.
If you want a per-order version of the same exercise, our article on ecommerce profit margins and true profit per order walks through it.
Compare, never read in isolation
A single month’s P&L is a weak guide. Compare it with:
- The previous month, to catch sudden changes.
- The same month last year, which strips out seasonality. For a seller, November and December can make every other month look poor.
- Your budget or forecast, which turns the report from history into a control tool.
This comparison reveals anomalies such as unexplained spikes in overheads or declining returns that a standalone report hides. Watch for one-off items too. Selling an asset, receiving a grant or paying an annual insurance premium in one lump can swing a single month. Mentally adjust for them before you decide the business is booming or failing.
If you want to see how profit relates to the cash actually in your bank account, a cash flow forecast is the companion document. Profit is not cash: stock purchases, VAT payments and loan repayments all move cash without appearing as expenses.
Check the P&L is trustworthy before you analyse it
Analysis is only as good as the bookkeeping. Before you draw conclusions, run through these checks:
- Bank accounts reconciled up to the end of the period, including your marketplace payout accounts and payment processors.
- Marketplace fees recorded. Payouts land in your bank net of fees, refunds and sometimes advertising. If you book only the payout as sales, revenue and costs are both understated.
- Stock counted or at least estimated. Without a year-end stock figure, cost of sales is wrong.
- Uncategorised transactions cleared. A large “suspense” or “uncoded” balance means the report is unfinished.
- Refunds and chargebacks matched to the right period.
- Foreign currency sales converted consistently.
In Xero, this is the work of bank reconciliation and clean coding. Tools that import your marketplace settlements as summarised journals can save a lot of manual effort. Our guide to how often you should update your books explains why monthly is the minimum for decisions you can rely on.
Accruals or cash basis: it changes how you read the page
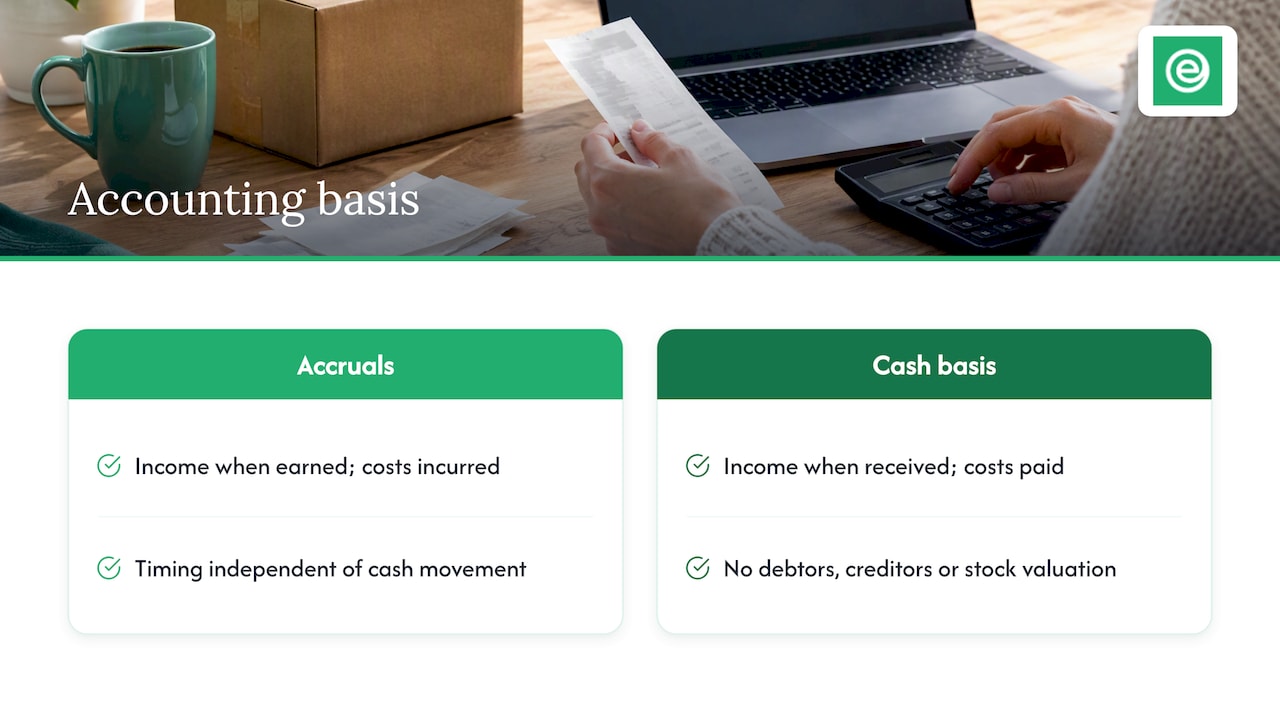
Under the accruals method, income and costs are recorded when they are earned or incurred, regardless of when money moves. That is why a P&L can show a profit while your bank balance is low.
The cash basis is different. HMRC describes it as a simpler way for eligible small businesses to account for income and expenses when money is received or paid out. Your P&L then follows cash movement only, with no debtors, creditors or stock valuation. For a seller who holds inventory, that is a poor fit, because you cannot see the true cost of what you sold. Our comparison of traditional accounting versus cash basis accounting sets out when each suits.
What your P&L tells you about VAT
Your P&L’s revenue line is the starting point for your VAT position, but it is not the same number. GOV.UK says you must register if your total taxable turnover for the last 12 months goes over £90,000, or you expect it to in the next 30 days. Taxable turnover covers most sales, including zero-rated goods, but not exempt supplies.
Two practical habits help:
- Track rolling 12-month turnover monthly, not by tax year. The test is a rolling one, not tied to April.
- Remember the rule is about taxable turnover, so a P&L that mixes in exempt income or non-trading receipts will mislead you.
If you do cross the line, the deadline is tight. We cover the consequences in what happens if you go over the VAT threshold. If you are a sole trader, see our guide to the £90,000 rolling threshold and the 30-day registration window.
Once registered, your P&L should show sales net of output VAT and costs net of recoverable input VAT. If you sell to the EU, OSS and IOSS add further VAT reporting on top, which is another reason to keep sales data clean by country and channel.
Limited companies: the P&L inside your statutory accounts
Directors of small companies usually prepare accounts under FRS 102 Section 1A, and ICAEW’s helpsheet explains the presentation and disclosure requirements for small entities. The accounts must give a true and fair view. The statutory P&L is often shorter than your management version, so keep a more detailed monthly report for decisions and let the year-end accounts serve compliance, tax and lenders.
If you want a wider tour of the reports you will meet, our piece on financial reports every business owner must understand covers the balance sheet and cash flow statement alongside the P&L.
Our perspective: what we see when sellers open their P&L
Most sellers who come to us can tell us their turnover to the pound and have no idea what their gross margin is. That is understandable: marketplace dashboards celebrate sales, not profit. But a dashboard is not a P&L, because it does not know your stock cost, your ad spend on other channels or your refunds across platforms.
Our approach is simple. Each client has a dedicated accountant, and we work in cloud software, including Xero and Link My Books, so the P&L is built from reconciled data rather than assembled at year end. When you can ask your own accountant why gross margin dropped two points, the report becomes a conversation instead of a PDF. Our advice: look at your P&L every month, compare it with the same month last year, and ask “why” about the two biggest movements. That habit does more for profit than any clever tax plan.
— Kris Corbisiero, Founder at eAccounts
Getting a P&L you can rely on
If reading the report is not the hard part but producing a reliable one is, that is what we do. Our All-inclusive plan is from £29 + VAT a month. It covers ongoing bookkeeping and VAT returns for online sellers, with a dedicated accountant working in Xero. If you are not an online seller, see our accounting packages or our bookkeeping services.
A quick monthly P&L routine
- Confirm all bank and marketplace accounts are reconciled.
- Check revenue is net of refunds and excludes VAT.
- Calculate gross margin and operating margin.
- Compare with last month, the same month last year and budget.
- Pick the two biggest movements and find the cause.
- Check rolling 12-month taxable turnover against the VAT threshold.
- Note any one-off items so you do not misread the trend.
FAQ
How do I check a profit and loss statement is correct?
Start with the bookkeeping: every bank account reconciled, no large uncategorised balances and a sensible stock figure. Then test the numbers. Does revenue match your sales reports after refunds and VAT? Do the margins look consistent with previous periods? If something has jumped without a reason, ask your accountant or bookkeeper to explain it.
What is the difference between gross profit and net profit?
Gross profit is revenue minus the direct cost of what you sold. Net profit is what remains after overheads, interest and tax. Gross profit tells you about your products and pricing. Net profit tells you about the whole business.
What is P&L analysis?
It means interpreting the statement rather than just reading it: calculating margins, comparing periods and finding the causes of change. The ACCA recommends looking at components such as margins instead of focusing only on the final profit figure.
How often should I look at my P&L?
Monthly is the sensible minimum for a growing seller, because it gives you time to react to a falling margin or rising costs. Quarterly suits very small, stable businesses, but problems can build for three months before you see them.
Sources
- ICAEW: About a business
- ACCA: Financial statements interpretation
- GOV.UK: Register for VAT
- HMRC Business Income Manual BIM70005: Cash basis overview
- ICAEW: FRS 102 Section 1A small entities